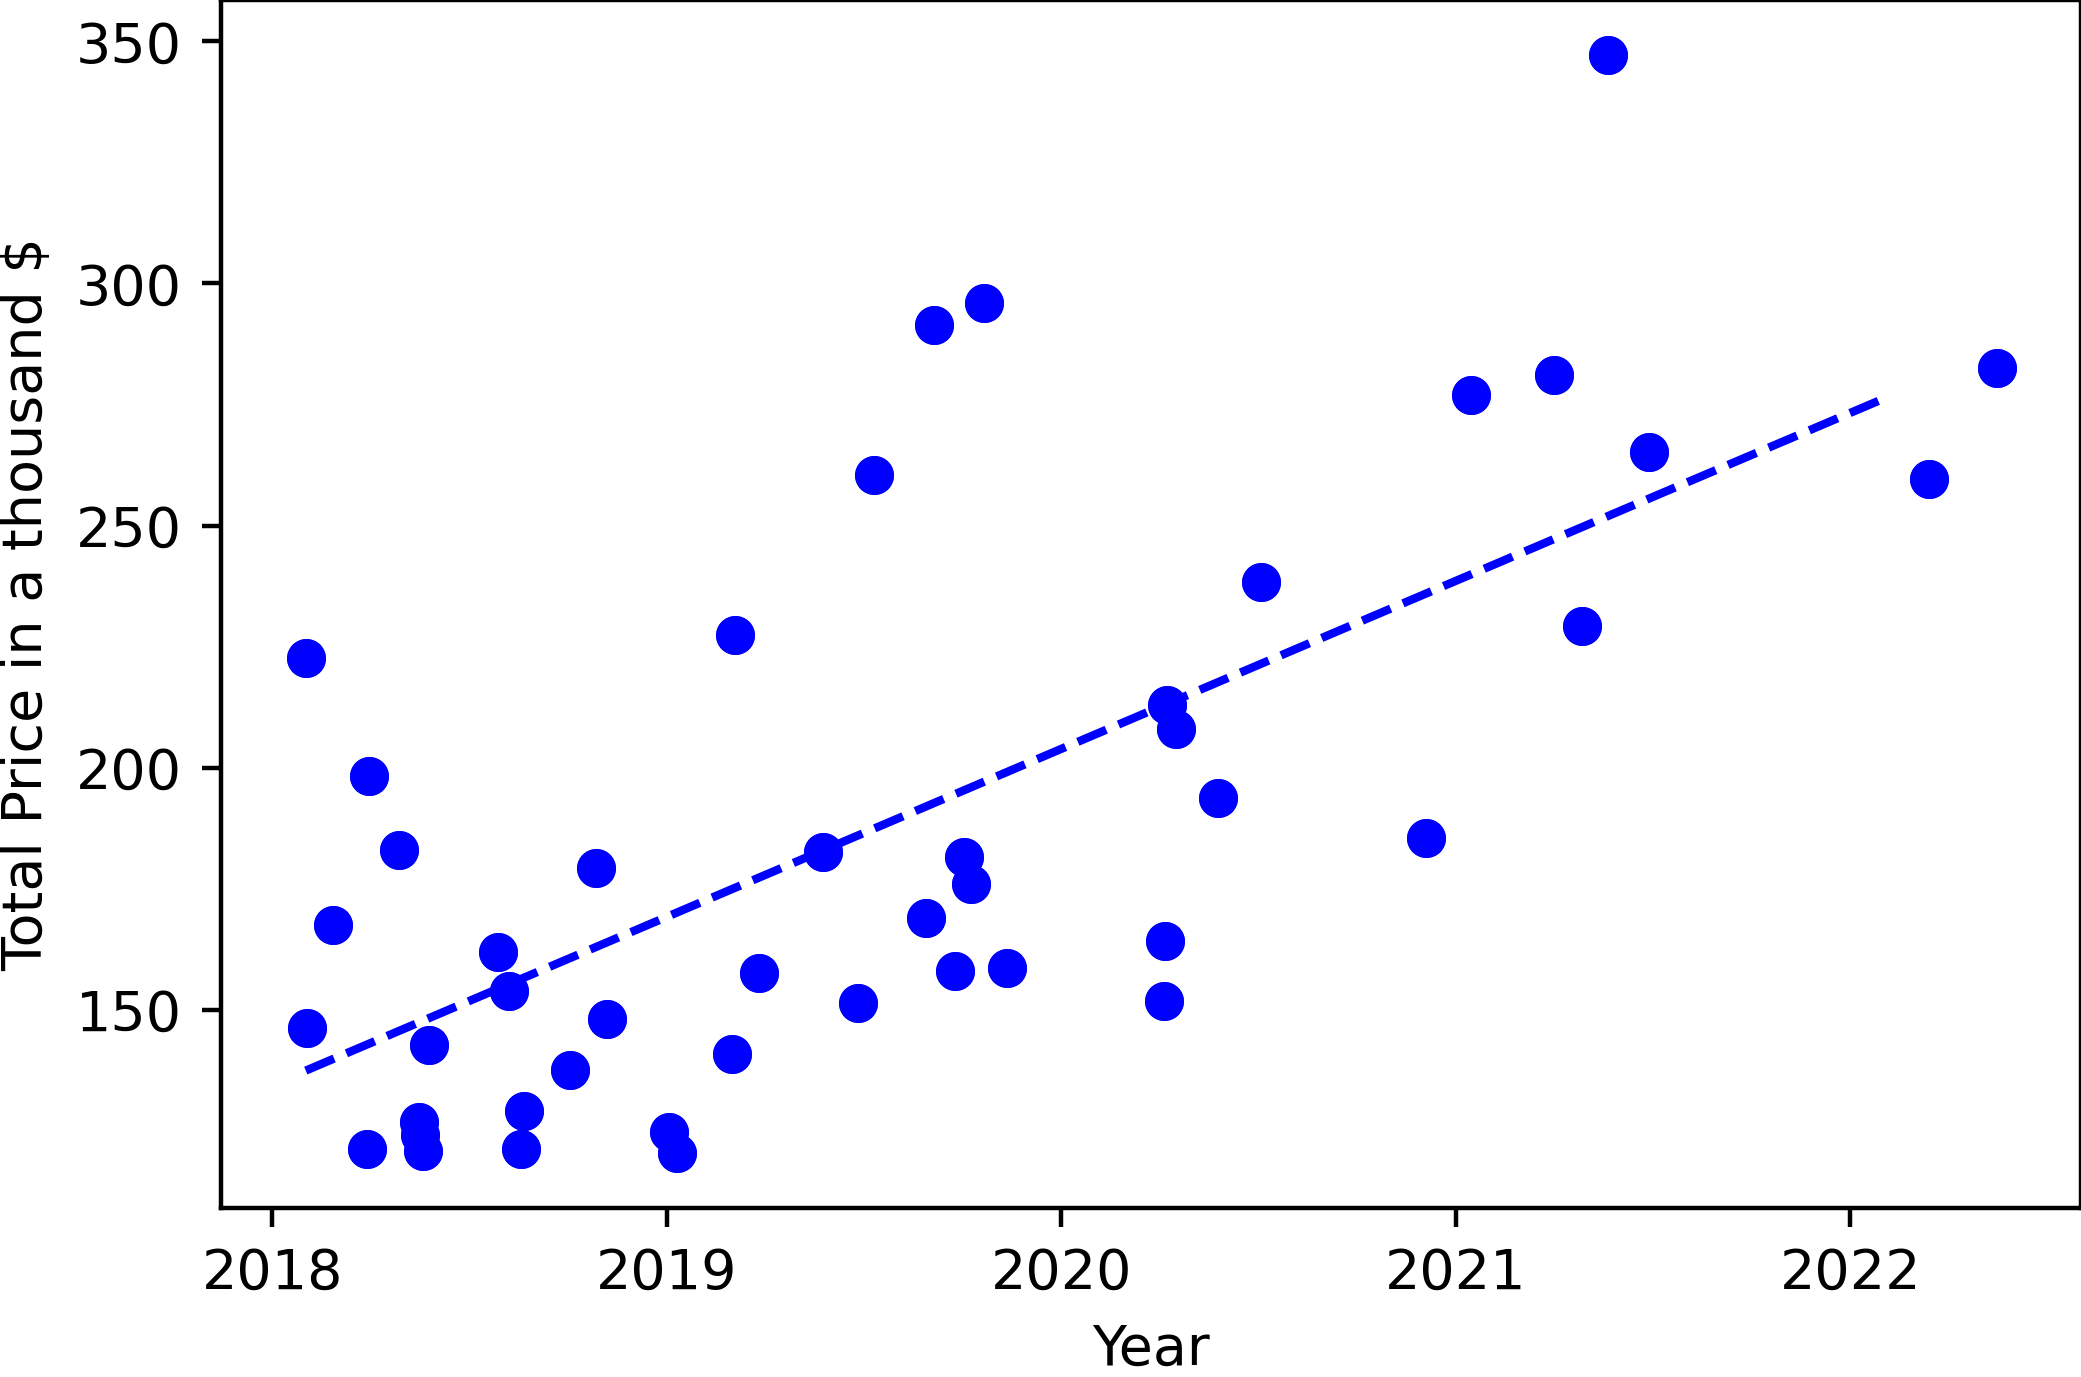
You are wrong. But it is totally fine! We can draw a line to fit the data points.
The process of drawing a line to fit the data points is called linear regression. (It is basically about solving equations 😂)
The process of drawing a line to fit the data points is called linear regression. (It is basically about solving equations 😂)